About
A LiNbO3 transducer, which generates and receives both compressional and shear waves simultaneously, is attached to the back side of the top WC anvil. An Al2O3 buffer rod is placed between the WC anvil and the sample. Elastic waves pass through the WC anvil, propagate through the Al2O3 buffer rod and enter the sample. A series of reflected elastic wave signals come from the interfaces of anvil/buffer rod (R0), buffer rod/sample (R1), sample/Al2O3 plate (R2), and Al2O3 plate/BN pressure medium (R3). Then, elastic wave velocity (\(v = d/{\tau}\)) is calculated using the elastic wave travel time and sample length determined by X-ray radiography measurement. (Kono et al. PEPI 228 (2014) 269–280)
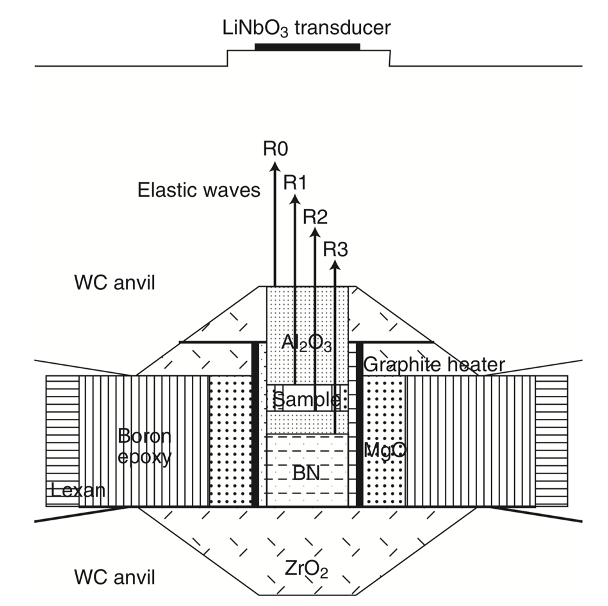
Ultrasound cell schematic
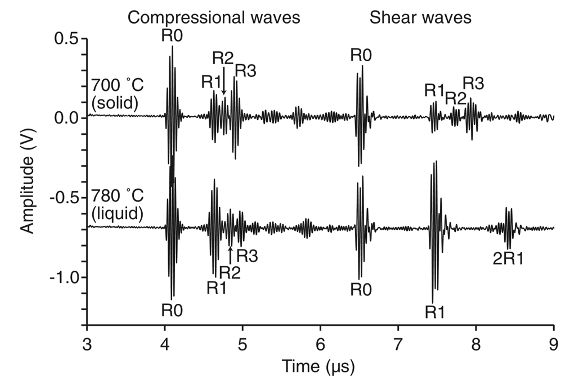
Elastic wave singnals
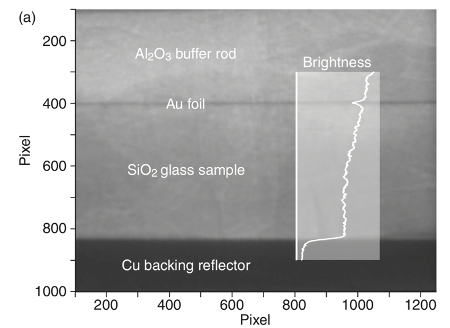
Radiography image
The data analysis package sonicPy consists of two GUI programs, Image-Analysis and Time-of-Flight that allow to estimate the values of (\(d\)) and (\({\tau}\)), respectively.
The goal of the Image-Analysis program is to perform measurements of the sample-thickness in the experimentally recorded radiography images. The sample-thickness corresponds to the travel distance (\(d\)) of the ultrasound wave.
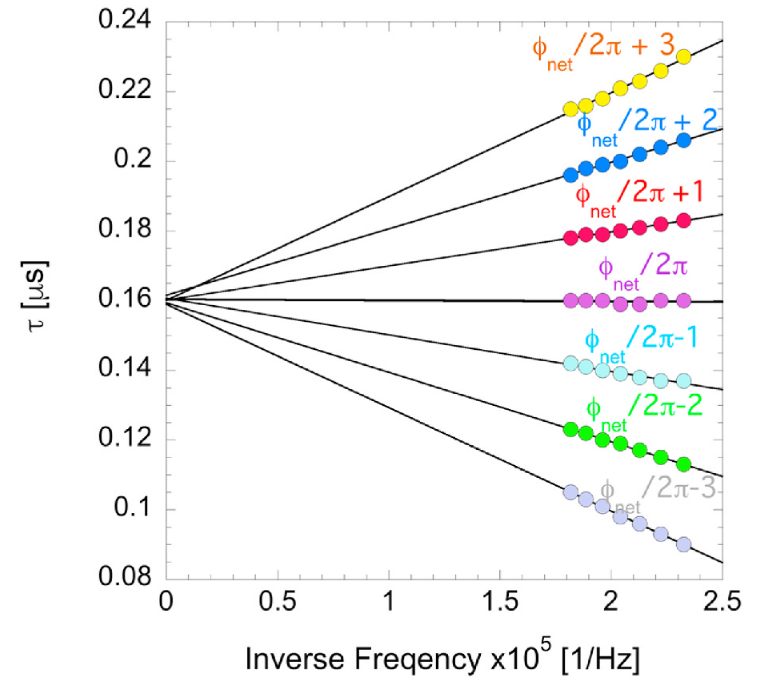
The Time-of-Flight program is used to determine the time shift (\({\tau}\)) between a series of experimentally recorded ultrasound echoes by performing cross-correlation.
The difference between R1 & R2 reflection = double travel time
\(R2 - R1 = 2 τ\)
The Time-of-flight program relies on the multiple frequency method to obtain the couplant-corrected wave travel times (Pantea et al. Rev. Sci. Instr. 2005, Sturtevant et al. Rev. Sci. Instr. 2020).