Click Open button to navigate to and select an radiography image file. Typically the
radiography files are saved in the Images folder
and have an extension *.tif.
The Compute button is a checkable button. When clicked the button will be in a checked state and highlighted orange. Clicking again unchecks the button. While in checked state the distances will be calculated automatically after selecting a file. The program extracts positions of the lower (Edge 1) and upper (Edge 2) edges by fitting a polynomial to edge pixel positions weighted by the the pixel intensities.
The thickness of the sample and standard deviation are displayed in units of nubmer of pixels.
Note
Use an appropriate
\({\mu}m / pixel\) resolution for your camera to calculate the thickness
The relolution can be found in your calibration folder, typically in a file manta_resolution.docx.
The relevant part of the image is automatically selected by a red box each time when a new image is opened.
For cases where a manual selection is needed or if you want to keep the same red box position when opening new images,
you can disable the autotomatic selection by un-selecting the Auto crop button.
If you have manually adjusted the red box position and would like to go back to the automatic selection,
select the Auto crop button.
Click the appropriate icon that looks closest to your sample edge configuration.
For exaple, the image below has two thin gold foils as edges, in this case we select the first choice from the left:
If an edge is very deformed try to use the option of polynomial order 3.
Note
The average sample thickness obtained from tilted or deformed edges
may still be usable for sound velocity calculation since the
standard deviation will reflect the thickness uncertainty and
can be propagated to the sound velocity uncertainty.
The file list panel displays the files in the currently opened folder. Clicking on a file selects it for processing. Calculated distance and uncertainty will be displayed next to a selected file.
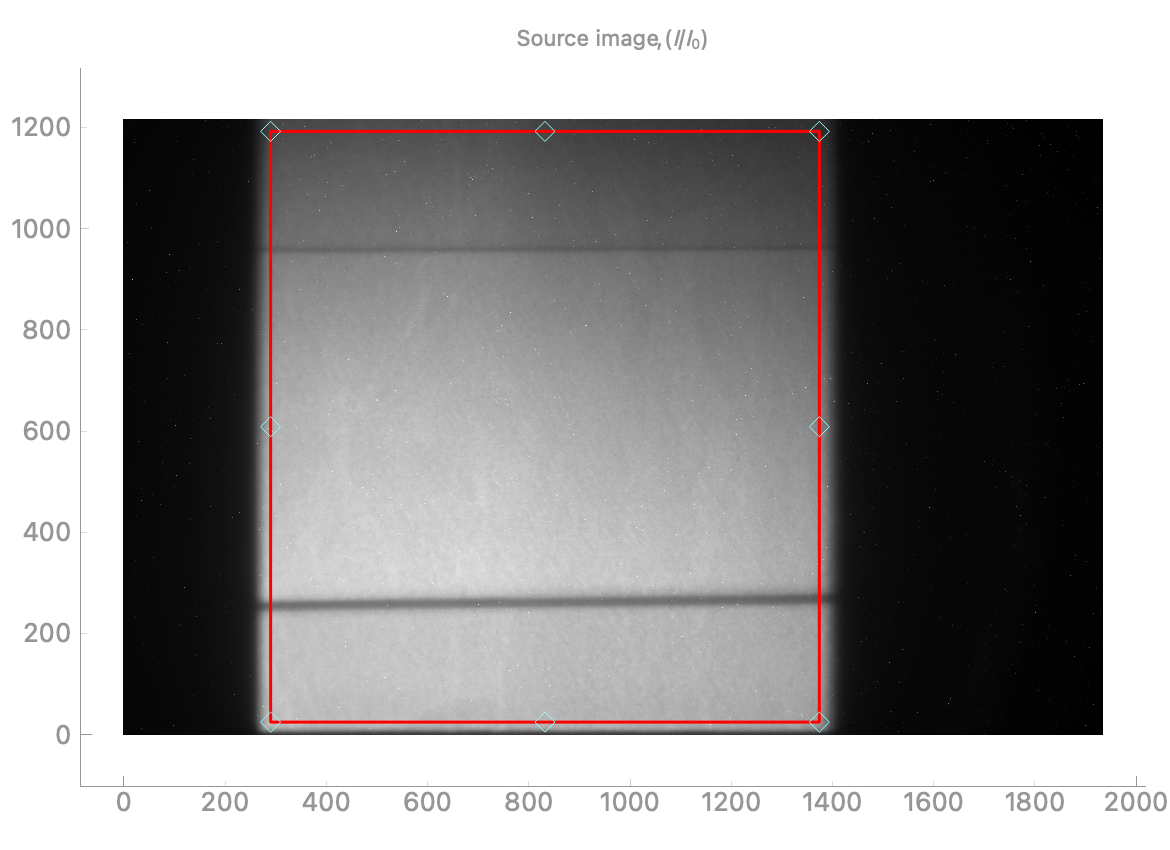
The top left panel displays the normalized image counts from the image, (I/I0).
The red box delimits the relevant part of the image that will be used for finding the edges.
Note
The red box can be adjusted by dragging the
diamond handles using a mouse. The region-of-interest selected by the red box
will be used for subsequent computations and edge finding.
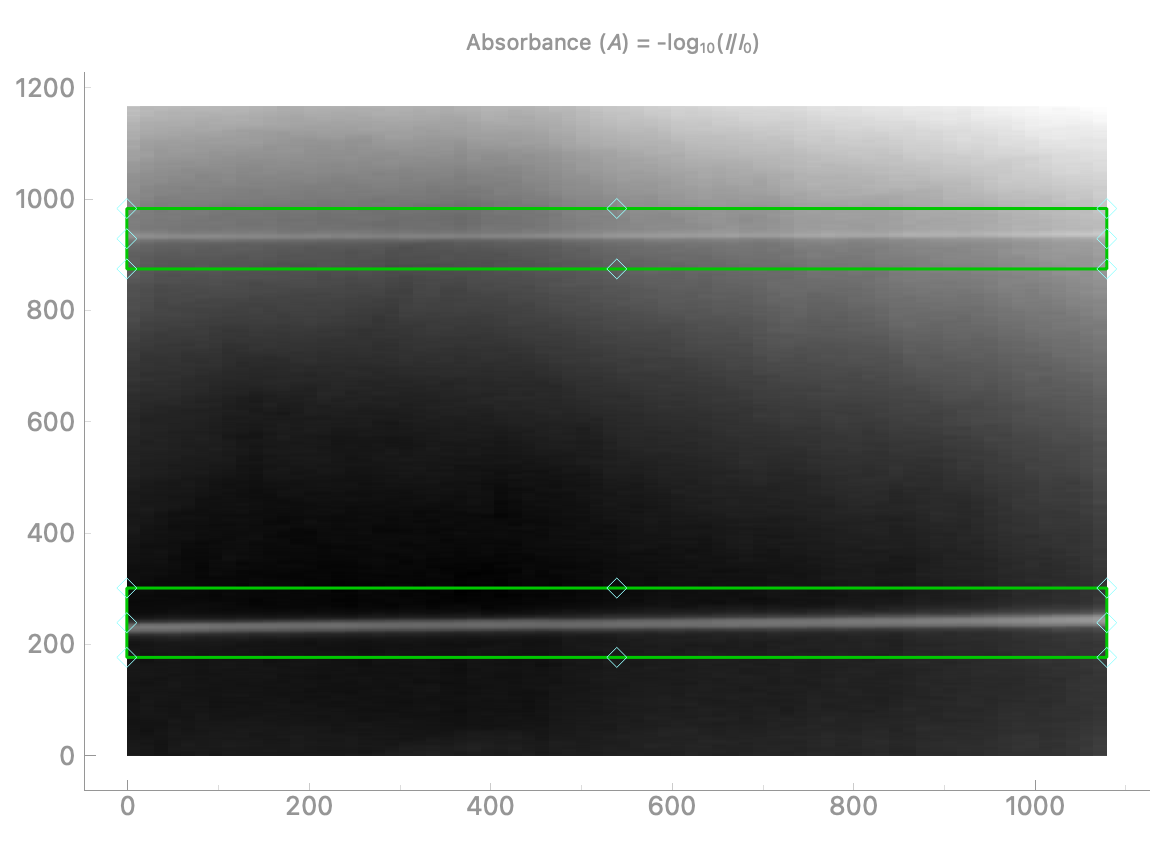
The bottom left panel displays the computed absorbance, (A) = -log10 (I/I0), taken
from the part of the image selected by the red box in the Source image.
The program will automatically locate the top and the bottom edges and overlay each edge with a green box.
Note
If the automatic edge finding fails, please select the edges manually.
The boxes can be adjusted by dragging the diamond handles using a mouse.
In the case below the edges are the gold (Au) foils.
The top right and the bottom right panels will display the edge fit results (red dashed lines), overlaid over
the observed edges. Check that the fit is good by checking that the red dashed lines match well the positions of the edges.
If the fit is not good, it may help to adjust the following: