Example walkthrough
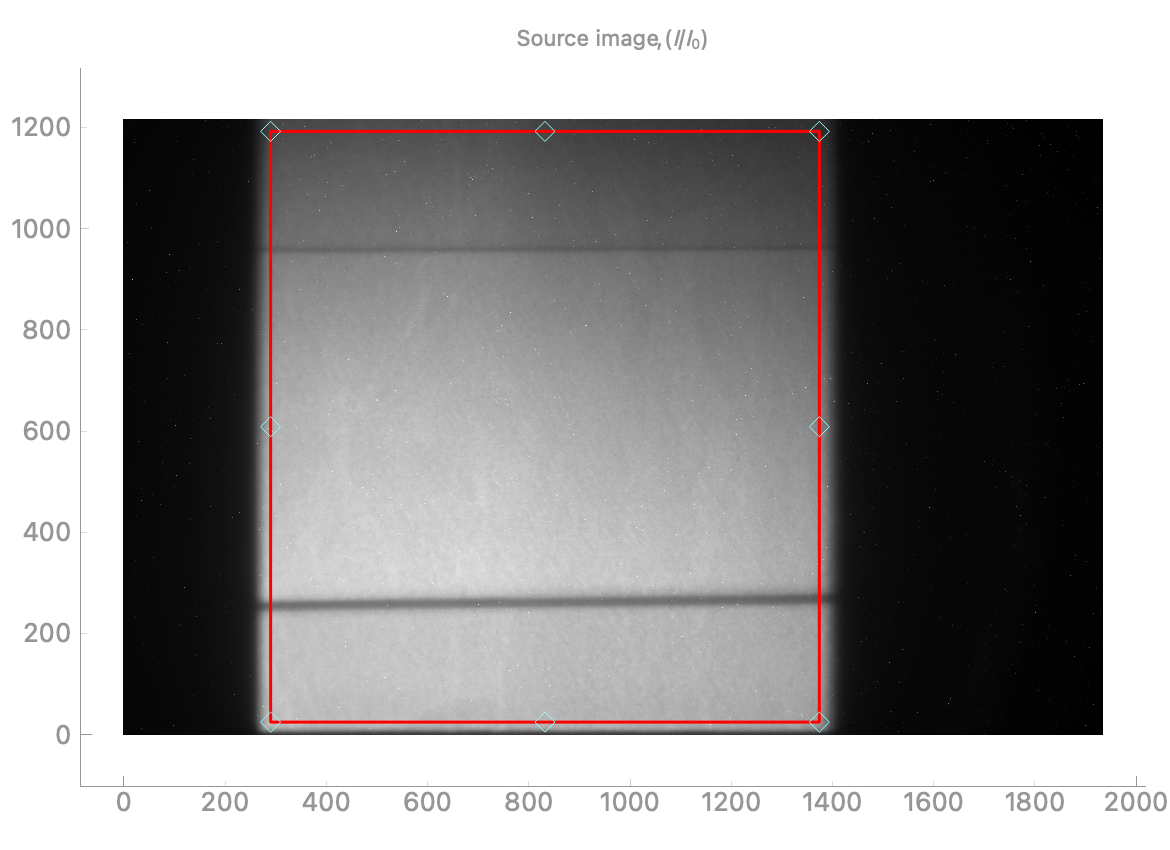
Click Open button in the upper left corner. Navigate to location of image file and open the file. The source image will be displayed in the top left image panel.
Note
The relevant part of the image is automatically selected, but manual selection adjustment may be needed.
Hint
Use the mouse scroll-wheel to zoom in and out of any of the images; the little A button in the lower left resets the zoom.
The program displays the selected edges automatically. Adjustable green boxes are overlaid over the selected edges.
Note
Make sure make sure the edges are selected correctly by the green boxes. The green boxes can be manually resized and/or re-positioned.
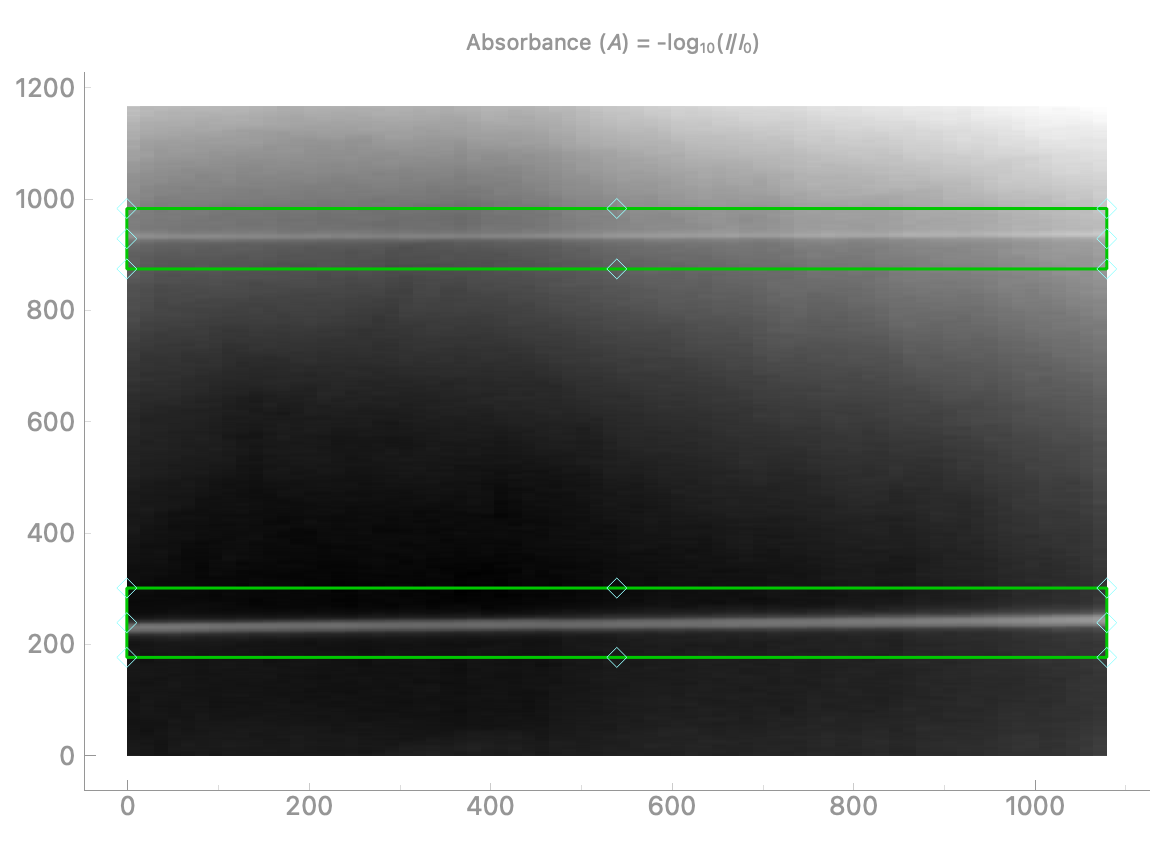
Select the sample edge type based on your particular sample configuration.
Once image cropped properly, click Compute in upper left corner. The fitted edge polynomials will be displayed in the Edge panels.
Note
You may need to adjust the fit threshold for edges with non-uniform contrast.
Note
Ideally the edges should be fit with a polynomial of order 1 or 2. However if the edge is not straight you can try to use a higher order polynomial.

The thickness of the sample and standard deviation are displayed at the top of the window in the units of number of pixels.
Repeat steps 1-5 for each image that you recorded.
Note
Other files in the same folder can be selected by clicking on other filenames in the File list in left panel. No need to click Open button to load each file.
Click Save results button to export the calculate distances and uncertainties to a
.csvfile.